
Decomposing the contents of a galaxy from observed properties, when we can't resolve individual stars, falls under the general heading of spectral synthesis. The galaxy luminosity as we measure it at some (emitted) wavelength l may be written as a sum of components i which have intrinsic luminosity density r(r) Li; we would like to know the total luminosity of this component (integrating r dV) for the galaxy, from which masses, stellar evolutionary conditions, and something about the galaxy history may be derived. The galaxy's total luminosity may be written

(where r is a vector position); which expression is, like the equation of radiative transfer, complete but practically useless. Observations at many wavelengths can constrain, if not specify, the densities ri if they have distinguishable Li (l) - that is to say, if their spectra are "different enough". The kinds of components we are interested in include:
For this kind of scheme to work, we need to (1) understand t(r, l); and (2) have a complete library of constituent spectra to work from; if an important one is missing not only do you get the wrong answer but you can't tell what's wrong. One in essence fits the observed spectrum as a sum of component functions (spectra), hoping that the astrophysically distinct ones are distinct enough to give nearly unique results. Some such knowledge is implicit in such hopeful assumptions as mass-traces-light, and that absolute magnitudes at some particular wavelength tell us much about a galaxy's scale.
The most straightforward approach uses components whose spectra are so unique that very straightforward analysis may be done (in plain English, measure the emission lines). Consider possible sources of radiation from a galaxy:
| Stars: | direct photospheric emission | (UV through mid-IR) |
| stellar winds | (emission lines, IR from dust shells) | |
| accretion phenomena | (binary X-ray sources, the odd SS 433 clone) | |
| Gas: | cold | (H I, molecular clouds) |
| warm (104 K, emission-line gas) | H II regions, planetary nebulae | |
| (reprocessed stellar ultraviolet ionizing radiation) | ||
| warmer (2-3 x 10⁴ K) | supernova remnants, shocked gas | |
| active nuclei | (whole range of conditions) | |
| hot (107 K) | typically X-ray gas, also seen in absorption lines | |
| Dust: | thermal emission | (reprocessed starlight, shock heating) |
| quasi-thermal | (transient heating of single grains) | |
| absorption | against starlight or emission-line sources | |
| scattering | (via polarization) |
Various of these dominate at different wavelengths, so we may begin to decompose galaxies into constituents even if we have only the integrated radiation to work with. Consider some schematic broad-band galaxy spectra. Note that these are often shown as n Fn vs. frequency, which gives power per frequency decade for direct comparison of energy budgets (as well as the occcasional game of "my wavelength is bigger than your wavelength"). As a concrete example, here is the integrated spectral energy distribution (SED) for the starburst galaxy NGC 7714, using broad-band data tabulated in NED,the integrated optical spectrum from the Kennicutt atlas (here occupying a mere octave of the 9-decade spectrum), and brand-new FUSE data for the region just below Lyman a.
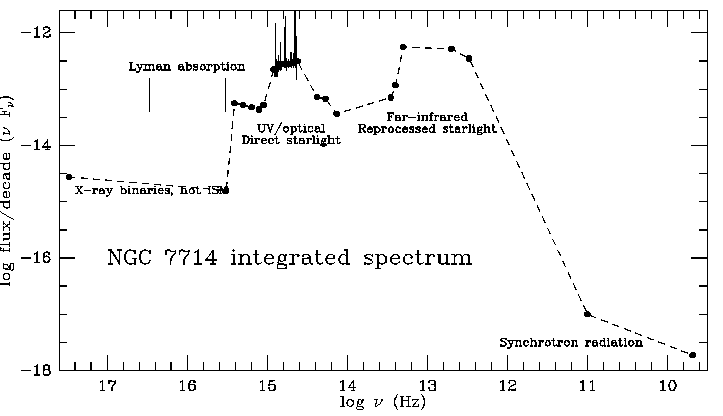
Stellar components can dominate in UV, visible, or far-IR (through dust emission) depending on the galaxy's history and structure. X-ray dominance and significant radio emission are produced by active nuclei.
The stellar content is fundamental to understanding a galaxy's history, given the interplay of stellar populations with interstellar matter and dynamics. Baade recognized a basic distinction between various parts of Local Group galaxies, in whether the brightest individually resolved stars are blue or red. The key papers are ApJ 100, 137 (1944) on M31 and M32, and ApJ 100, 147 (1944) on NGC 147 and 185; these included actual second-generation photographic prints from Mt. Wilson material because printing wasn't capable of preserving the faint stellar images adequately. The differences between these populations may be understood by considering the H-R diagrams of young (less than 109 years) and old (say 1010 years) groups of stars. The young stars will have few red giants, and a main sequence reaching to blue colors and high temperatures, while the older population's brightest members will be red giants and the main sequence will be truncated at cooler temperatures (lower masses, redder colors) as stellar evolution eats away down the mass sequence. This figure (from Baade 1944 on M31/M32, courtesy the AAS) shows the difference.
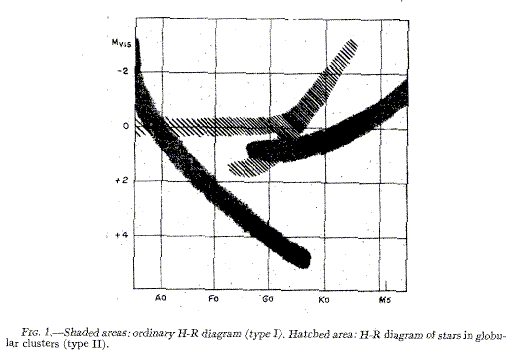
The population designations are chosen to make the Sun Population I. The best-studied Pop II systems are globular clusters (which fact seriously biassed our understanding until recently), which are old (1.0-1.4 x 10¹⁰ years) and have low metallicity ~0.01 solar - this especially is not a defining Pop II characteristic, as galactic bulges have ranges going up to strong-lined stars with above-solar metal abundances. Interpreting the details of a stellar population is complicated by such facts as:
Even with all this, kinematic and distribution differences between populations are unmistakeable in nearby galaxies. We can see where certain features of the H-R diagram are by direct observation in nearby galaxies, exemplified by the cases of the Leo II dwarf spheroidal galaxy (from Mighell and Rich 1996 AJ 111, 777) and the Carina dwarf galaxy (Hurley-Keller et al. 1998 AJ 115, 1840, courtesy AAS). In the Carina data, excerpted from a multipanel figure, the vertical axis in V magnitude runs from 17 to 26, and the horizontal axis represents B-V.
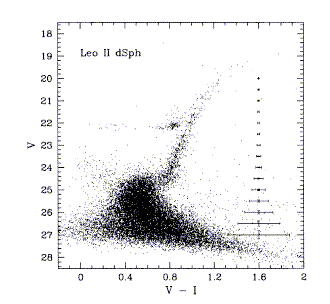
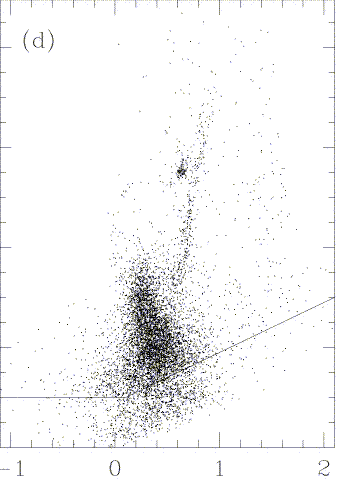
Data such as these, and star-by-star spectroscopy of Galactic bulge giants (Whitford, Rich, Frogel), tell us about the luminosity function and metallicity ranges for giants. The different scales qand passbands shown obscure changes in the slope of the giant branch, but the differing nature of the horizontal branch is still clear. Note as well, the distinct multiple populations in Carina. Some of the complexities of the "population 1/2" approach when applied to galaxies with diverse star-forming histories are discussed by Hodge (1989 ARA&A 27, 139).
For nearby galaxies (and by now, for supergiants, "nearby" can go all the way out to the Virgo cluster) we can observe the brightest individual stars, telling us more than we can extract from integrated light. The properties of these stars depend on their mass-loss history, and thus largely on metallicity. On the main sequence, the temperature for a given mass and spectral type will be lower for higher abundances, showing up as changes in the stars' distribution across the upper HR diagram, in the excitation of surrounding H II regions, and in the relative numbers of O and WR stars. The strong winds in WR stars are largely driven by radiation pressure on metal ions in their atmospheres, so these are believed to be more numerous at higher metallicity (and the wind features are, indeed, stronger for higher-metallicity systems, to the point that one can use far-UV wind lines as metallicity indicators). Being able to look deeper into the normal red giant population gives the history of star formation over Gyr timescales.
In more distant galaxies we must interpret integrated light and perform some kind of spectral synthesis to match the observed overall spectrum. In principle (i.e. mathematically speaking) one could recover the relative contributions of various stellar types if (1) we understand all types producing significant light, (2) geometrical (obscuration, reddening) effects aren't important, (3) a long enough wavelength baseline is observed, and (4) the data are "good enough".
This approach begins with understanding which stars spend how long where on the H-R diagram, and what their spectra look like at these locations. We start from some distribution of stars analogous to that shown by Kennicutt's Figure 4 in Stellar Populations. There doesn't seem to be such a figure available electronically without waiting on copyright permission, so I'll illustrate the point with this Hipparcos HR diagram, showing the density of stars in various parts of the color-magnitude domain. This is from an observed sample so it's luminosity-weighted in an inappropriate way to actually base a synthesis on, but you'll get the idea.
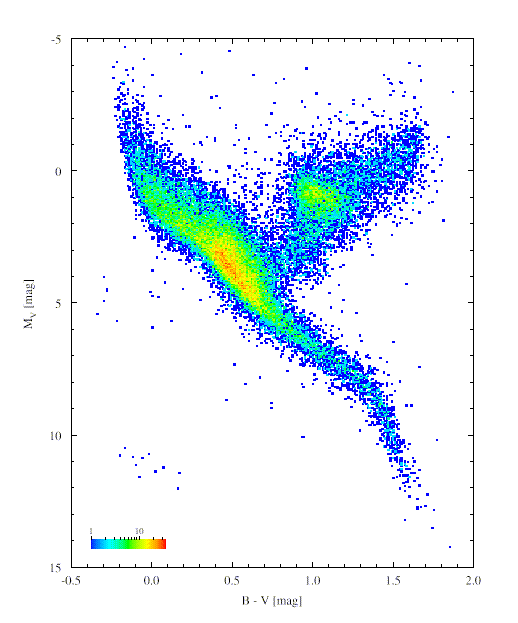
These densities, giving number of stars along the main sequence and implying the rate of evolution for stars beyond it, are combined with theoretical evolutionary tracks for stars of various mass and initial metallicity.
At this point we may either do an evolutionary synthesis - starting with a hypothesized population (age, SFR, metallicity) and predict a spectrum as a function of time; or use population synthesis - fitting the observed spectrum to infer SFR, age, metallicity, perhaps with various "astrophysically reasonable" constraints connecting various components in the H-R diagram. Some typical ingredients for this approach were illustrated in Keel 1983 (ApJ 269, 466, fig. 12):
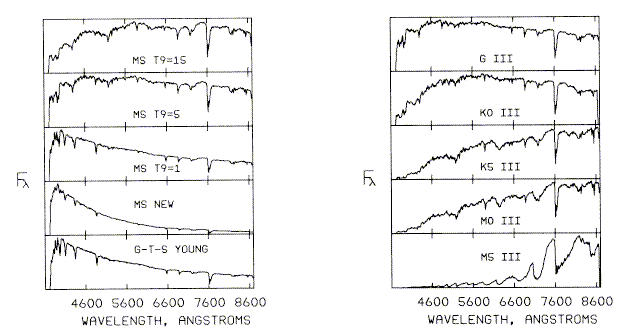
It is also instructive to examine a library of stellar spectra, such as that of Jacoby, Hunter, and Christian 1984 (ApJ Suppl. 56, 257; also available on disk as IRAF images) or Gunn, Stryker, and Tinsley 1981 (ApJ 249, 48) - at lower spectral resolution but covering a longer wavelength baseline. Similar atlases have been attempted in the UV using IUE data - Wu et al. 1093, IUE Ultraviolet Spectral Atlas (NASA IUE Newsletter 22, 1), Heck et al. 1984, IUE Low Dispersion Reference Atlas (ESA: Noordwijk), Fanelli et al. 1990 (ApJ 364, 272). Recently, Leitherer and a 12-line list of co-authors (PASP 108, 996, 1996) have compiled a very extensive data collection of galaxy-evolution inputs, with the tables appearing in the AAS CD-ROM series (disk 7, 1996 part 2). Many of the difficulties found in dealing with galaxies may be traced to a lack of very high-metallicity stars in our neighborhood for inclusion in such compilations, and the often-subtle changes in late stages of stellar evolution with metallicity.
Typical spectral synthesis results look like this (again shamelessly taken from Keel 1983):
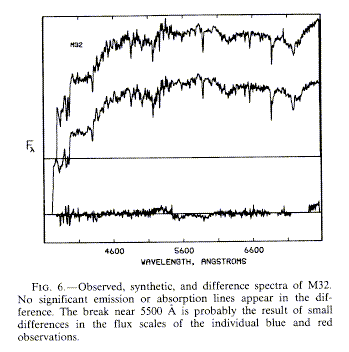
in which the observed spectrum is at the top, the model spectrum composed from solar-neighborhood stars below, and the difference at the bottom. The jump near 5600 Å is due to splicing together data with different grating settings; this kind of analysis tests one's ability to do absolute spectrophotometric calibrations. The fitting itself may use various algorithms and weighting schemes, which might stress line strengths or continuum shapes. For instance, some schemes have used only equivalent widths of various absorption lines, sometimes with the intensity of Balmer emission as a constraint on the total number of OB stars. Lines are selected to include sets which are sensitive to temperature, pressure (i.e. dwarfs, giant, supergiants), and metallicity. Note that any system composed of a mix of spectral types will have different kinds of stars dominating at different wavelengths - that's why this technique works at all. Once the behavior of a strong feature is well understood spectroscopically, it may be more efficient to map its spatial variation via narrow-band imaging (Baum, Thomsen, and Morgan 1986, ApJ 301, 83).
A review by O'Connell in Stellar Populations outlines some cautions. Some important references for spectral synthesis are given in the table below. Some patterns have emerged. The V-band light from old populations (ellipticals, spiral nuclei and bulges) is about evenly split between red giants and main-sequence stars. It is particularly easy to recognize such populations with a single superimposed burst (so-called E+A systems; see Dressler and Gunn 1982 ApJ 270, 7). Much work has concentrated on ellipticals as the galaxies with the simplest star-formation history, presumably approximated by a single burst and subsequent passive evolution. Many ellipticals have shown an unexpected excess of UV flux shortward of about 1500Å, indicating that there is a significant population of hot stars. These are widely thought to be evolved, post-asymptotic-giant-branch (PAGB) stars (aka planetary nebula nuclei); deep UV observations with HUT suggest that the dominant source of this UV light may be different for different luminosities/metallicities - Brown, Ferguson and Davidsen (1995 ApJL 454, L15) implicate the extreme horizontal branch for luminous ellipticals, while the M31 bulge UV component is hotter (Ferguson and Davidsen 1993 ApJ 408, 92), suggesting a stronger contribution from post-AGB stars.
| Spinrad and Taylor | 1971 | ApJ Suppl. 22,245 | (photoelectric, stars and ellipticals) |
| Joly and Andrillat | 1973 | A&A 26, 95 | |
| 1976 | A&A 50, 279 | (photographic+broad-band photometry, galactic nuclei) | |
| Faber | 1972 | A&A 20, 361 | technical discussion |
| O'Connell | 1976 | ApJ 206, 370 | Giant ellipticals |
| Tinsley | 1976 | ApJ 203, 63 | Basic theory of evolutionary synthesis |
| Tinsley and Gunn | 1976 | ApJ 203, 52 | Elliptical galaxies, stars |
| Gunn, Stryker & Tinsley | 1981 | ApJ 249, 48 | Evol. synthesis of ellipticals |
| Pritchett and Campbell | 1980 | ApJ 240, 768 | Role of selective abundance changes |
| Bruzual | 1983 | ApJ 273, 105 | Spectral evolution |
| Bica | 1988 | A&A 195, 76 | Use of star clusters as tests and ingredients |
| Gregg | 1989 | ApJ 337, 45 | Differential synthesis and S0 ages |
| Bruzual & Charlot | 1993 | ApJ 405, 538 | Description of popular GISSEL synthesis software |
| Worthey | 1994 | ApJS 95, 107 | Improved metallicity tratment |
Worthey's code is available on the Web for dial-it-yourself spectral synthesis models. Recently the Padova models (actually the isochrones from Bertelli et al. 1994 A&AS 97, 851 with the Worthey stellar models) became similarly available. The STScI group also has a WWW library of young population models.
General problems remain: very red and very blue stars are not well represented in the libraries; neither are very metal-rich strong-lined stars. Synthesis results may be sensitive to dust. OB stars have most of their light in the ionizing UV, so they are seen only through H II regions. We thus seek indirect tracers of (massive-) star formation through their effects on the interstellar medium.
Star clusters can also be powerful tracers of the stellar population. Globular clusters are especially nice because they are bright, compact (thus long-lasting) and can be seen a long way off. The census of globulars in various galaxies poses some interesting quandaries (van den Bergh 2000 PASP 112, 932 and large numbers of his earlier papers). The luminosity function of globular clusters is surprisingly consistent from galaxy to galaxy, roughly Gaussian with a peak at about MV=-7.5 (which has been used as a distance indicator). However, the number of clusters varies enormously. This is often quantified as the specific frequency S, the number of clusters per unit luminosity, where for specificity S=1 corresponds to a single cluster per MV=-15 of starlight. The values range from S=0.5 in late-type spirals, through S=1 for Sa/Sb spirals, to 2.5 for typical isolated ellipticals, with values above 10 for some cluster members. On top of this, some central cluster galaxies range as high as 30. Such values place stringent limits on the histories of galaxies, in particular the notion of building ellipticals by violent mergers of disk systems. Furthermore, some globular cluster systems show bimodal color distributions, suggesting formation at distinct times during the buildup of metals (which is in broad accord with a merger scenario). On the other hand, the globular-cluster populations correlate better with galaxy properties than would be expected from a merger scheme, leading to ideas involving a second epoch of cluster formation from gas which has fallen back from a galactic wind rather than a separate galaxy (Larsen et al. 2001 AJ 121, 2974).
The super star clusters seen in starbursts, and often in merging systems, play an important role in sorting this out. Will they, or will they not, someday age to become what we recognize as a globular cluster? Evidence to this point is contradictory. Their luminosity functions often resemble the power law seen for open clusters in nearby galaxies, rather than the Gaussian forms for globular clusters. To make such a transition requires a combination of disruption of fainter clusters and fading over time. The missing element is being sure that the luminosity function in the young, bright clusters is "normal", rather than being weighted toward the more massive stars that we actually see. Velocity dispersions of a couple of nearby examples (Ho and Filippenko 1996 ApJL 466, L83) suggest that indeed they do have large amounts of mass in low-mass stars, someday becoming old and rich globular clusters. In any case, star-cluster populations provide sets of coeval objects whose colors are systematic with age and metallicity, and therefore they can be used to provide some of the information sought from HR diagrams for galaxies at much greater distances.
Last changes: 9/2006 © 2000-6